Single Job Submission
This is a simple walkthrough for gke job submission from caliban.
Pre-submission Cluster Status
In this example, we have an existing cluster with no jobs currently running. You
can inspect the cluster from the GCP dashboard for your project under the
Kubernetes Engine > Clusters menu.
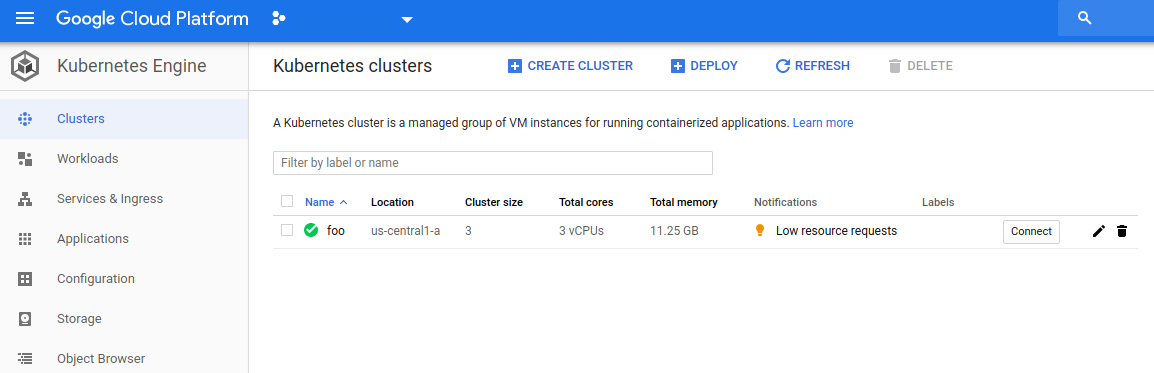
Selecting our foo cluster, we can see more details.
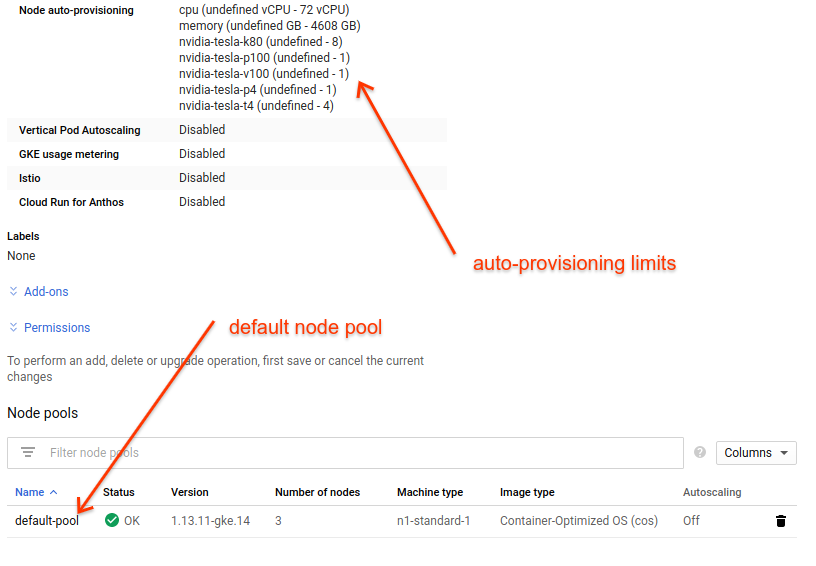
Here we can see that our cluster has only a single node pool: the default pool created when we started the cluster. We will submit a job that uses gpu acceleration, so we will see how the cluster autoscaler will add a new node pool for our job based on the gpu and machine specs we provide in the job submission.
We can also see here our cluster limits for autoscaling, which are derived from our zone quota. These limits control how many instances of different accelerator resources we can get via autoprovisioning. These limits are cluster-wide, so in this example we can get at most eight K80 gpus, and at most four T4 gpus.
Submit the Job
To submit a job to your cluster, use the caliban cluster job submit command.
(see caliban cluster for additional examples and documentation.)
Here we create our cluster job (some of output elided):
totoro@totoro:$ caliban cluster job submit --gpu_spec 1xK80 --name cifar10-test cifar10_resnet_train.sh --
I0204 11:33:48.564418 139920906995520 core.py:386] Generating Docker image with parameters:
I0204 11:33:48.565413 139920906995520 core.py:387] {'adc_path': '/usr/local/google/home/totoro/.config/gcloud/application_default_credentials.json',
 'credentials_path': '/usr/local/google/home/totoro/.config/service_keys/totoro_key.json',
 'extra_dirs': None,
 'job_mode': <JobMode.GPU: 2>,
 'package': Package(executable=['/bin/bash'], package_path='.', script_path='cifar10_resnet_train.sh', main_module=None),
 'requirements_path': 'requirements.txt',
 'setup_extras': None}
I0204 11:33:48.566865 139920906995520 docker.py:497] Running command: docker build --rm -f- /usr/local/google/home/totoro/sw/tensorflow_models
Sending build context to Docker daemon  1.058GB

Step 1/15 : FROM gcr.io/blueshift-playground/blueshift:gpu
 ---> 74f198a8ba19

 ...

6cebf3abed5f: Layer already exists
latest: digest: sha256:99c759693d78c24d0b6441e70d5b5538541cccaa158142b5896fadebc30b7ab9 size: 6608
I0204 11:35:12.189604 139920906995520 cli.py:431] submitted job:
cifar10-test-tsnlf:
https://console.cloud.google.com/kubernetes/job/us-central1-a/foo/default/cifar10-test-tsnlf
Our job has now been submitted to our cluster. Due to various factors, it will take a short time before the job is actually running. We can use the link provided by caliban to monitor the life cycle of our job.
Monitor Autoscaling/Job Placement
When we first submit the job, we will often see that the job shows what appears to be an error with a big, ugly, red message saying something along the lines of “unschedulable”.

We need to look at the ‘details’ on the right side to see how the Kubernetes pod associated with this job is progressing. The job right now is unschedulable because the cluster has not yet scaled up to accomodate our request. Choosing the ‘details’ button, we see this.
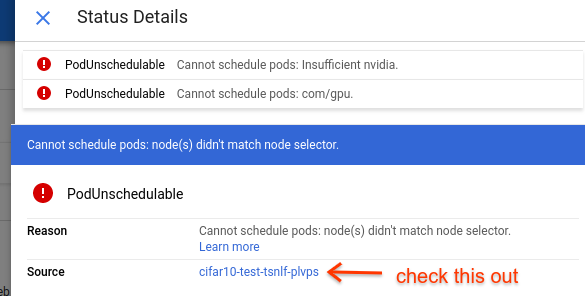
This is the pod associated with our job. Clicking on this shows us details on the pod, where we can watch its development. On the pod page, choose the ‘Events’ tab.
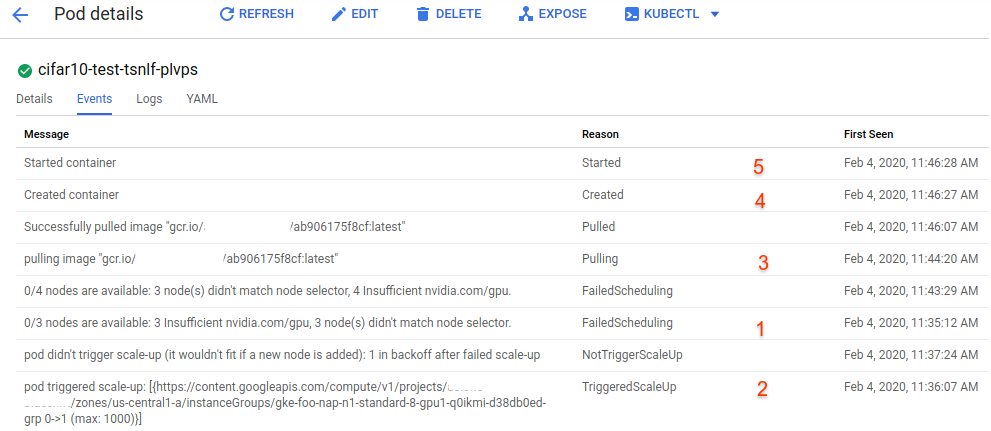
Here we can see the progression of the pod. (note that the events here are in order of ‘last seen’, so they appear out-of-order when trying to divine the logical progression of your job) The first event indicates that initially the cluster does not have any resources to support the pod. The second event shows that the cluster is scaling up to accomodate this job. This is often the crucial step. The next relevant event (3) shows that our docker image is being pulled for our new container. This is then followed by (4) container creation, and then (5) container start. At this point our job is up and running. Note from the timestamps that this process took (in this case) approximately ten minutes from submission to container operation.
While this process is progressing, we can also monitor the cluster and its node pools from the cluster page:
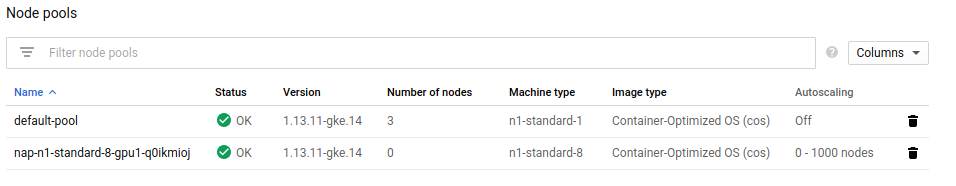
Now we can see that the cluster has auto-provisioned a new node pool for us in response to our job submission. Exploring this further you can find the new node instance that was created and inspect its properties. Once your job has completed, and if there are no more jobs pending, the cluster will scale down, deleting the compute node and deleting the node pool.
Monitor Job Logs
Now that our job is running, we can monitor the logs from the container from the dashboard using stackdriver (Kubernetes Engine > Workloads > our-job):
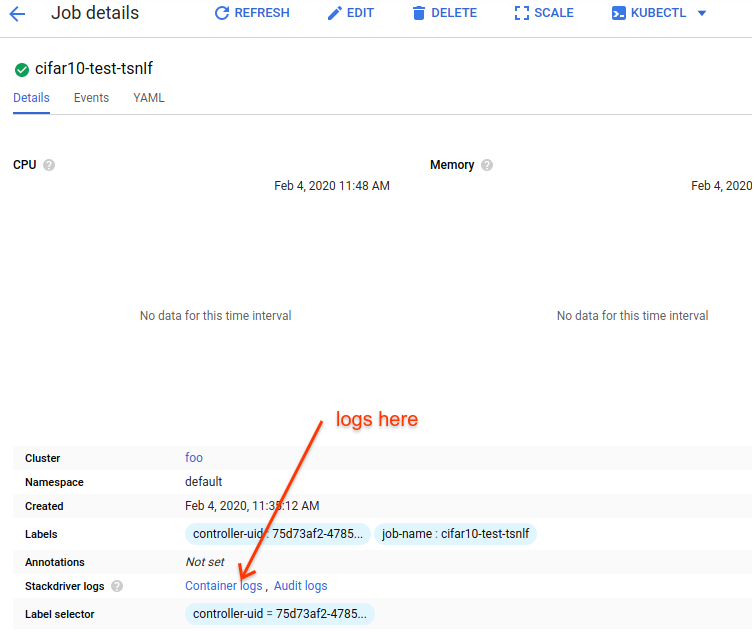
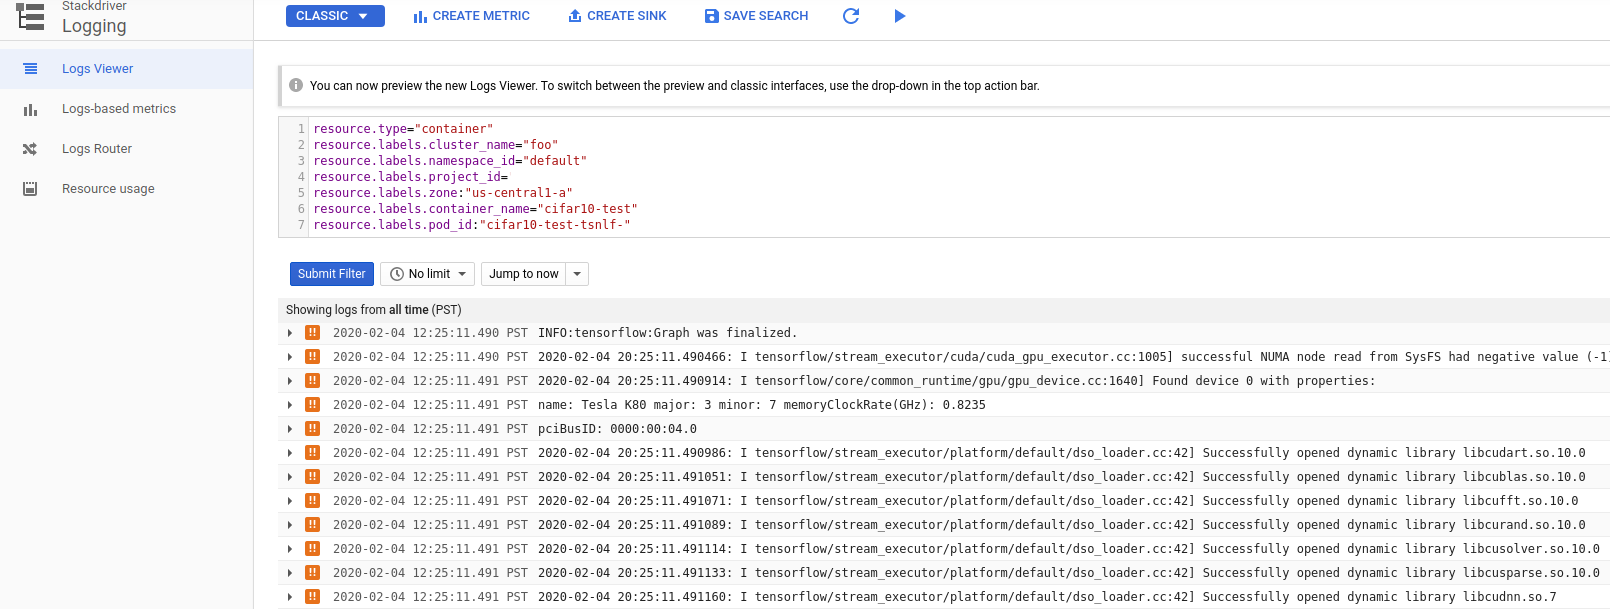
This will take you to the stackdriver log viewer for the container:
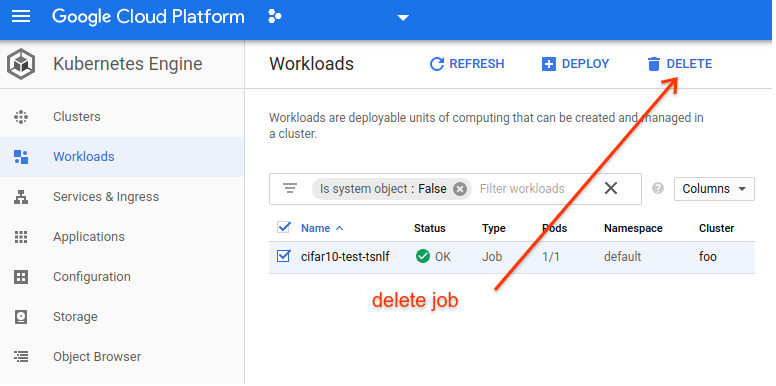
Clean up Job
Once our job has finished, its logs and other data will persist until we delete it, even though the container has been stopped and no compute resources are still active. This is quite useful of course, but at some point you will want to delete the job (which will delete all of the logs and associated metadata, so use caution)